What actions can I take on the main screen?
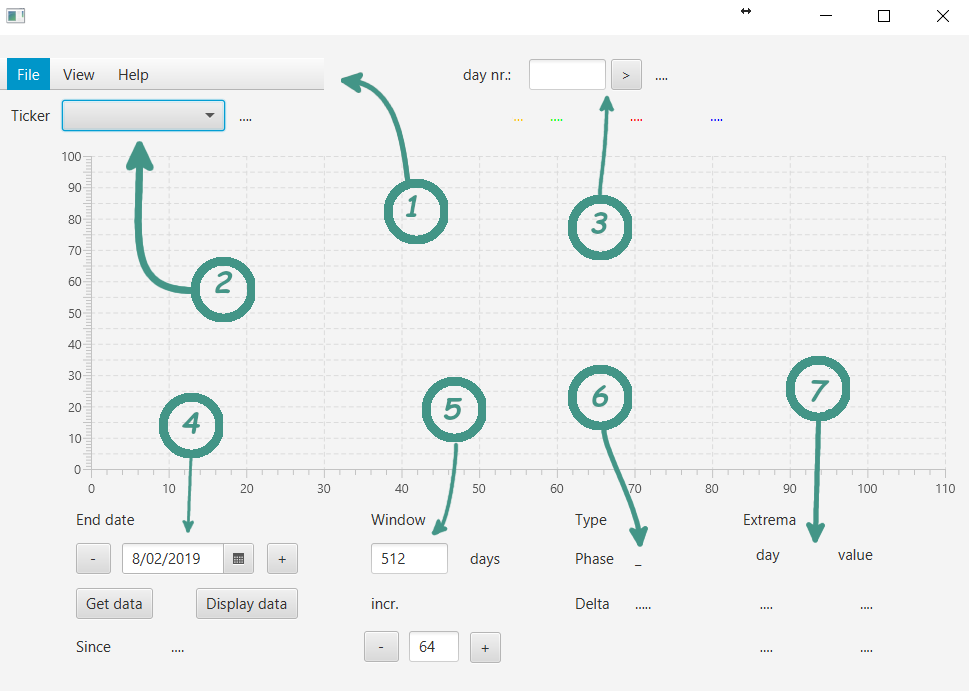
Fig. 17 A view of the principal screen and its components
Here is a summary of the possibilities:
1. The elements in the menu bar will enable you to do maintenance of the database, print out reports and change the view mode of the results.
2. In this part one can chose a ticker from a drop-down list. These tickers must be conform to the denominations used by on the Yahoo Finance page. For instance the stock "Anheuser-Bush inBev S.A." has the ticker "ABI.BR", anything else will not be accepted! If you don't know the ticker of the company just type in the company name one the seek-bar on top of their page and it will return the ticker. As an example if you type "ack" then you will find that the company "Ackermans & Van Haaren NV" has the ticker "ACKB.BR". Once you have selected a ticker you can proceed to the next step in 4.
3. Since there are no date tags on the horizontal axis this field gives the possibility to enter a number of days into the past. If you press the ">" key the system will give you the date corresponding to that value as well as the values of the stock and its deviation values.
4. A date picker permits you to go back in time. Every time you chose a ticker the date will be set to system time. The date you chose, or the preset date will be considered as a kind of "today", in the sense that only data preceding this date are taken into account. The purpose is that you can train yourself in making an appreciation of a stock. Use the + and - buttons beside the date picker to advance or go back a day. Once a button pushed you can use the space bar instead, so you avoid getting a "mouse arm". Once a date chosen press "Get data", then the data will be loaded for graphical representation. To actually display the data press "Display data". You can occasionally first change the preset window date to another value than 512 (± two years of working days).
5. The window field is preset to a value of 512, you can change it manually or use the "+" and "-" buttons below to augment or diminish the value of the window with an amount defined in the field "incr." which is preset to a value of 64 (± a quarter), but you can change that too. Notice that pressing the "+" and "-" buttons automatically execute a "Display data".
6. Here, after the data has been displayed the phase is shown together with the deviation .
7. The information given here can be of some major importance. Imagine we have a stock that presents a phase "B". This means a dip is expected (buy !) but two things can go wrong: a) the date of expectation can be ridiculously far away or b) the value at the minimum date can be only lower than a ridiculously small amount as the actual value. On the other hand if we consider the maximum (which is in the past for a phase B), its date could be just a few days ago which makes it rather a late, over time, phase E (sell!).
The next page will show a real life situation where the C.R. of an actual stock is evaluated.