What else can I use to get more information about a stock?
JavaFX does not allow to have dates as labels on the horizontal axis, so numbers are used to represent dates in the past to indicate the number of days ago. To obtain the effective date, and the corresponding graphical values fill in the "day" field and click on the ">" button. In our example we see that the after reaching a top of 54 € at day -340 it went tumbling down until day -300. To know when this happened fill in 300 in the "day" field and click ">". The result is depicted in fig. 22:
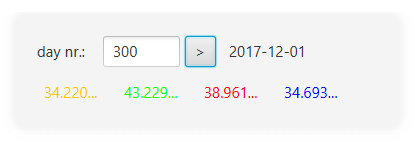
Fig. 22 Returning to the past 300 days ago.
We see that this happened the first of December 2017 and that values of the graph are displayed as well. This information can be used to google additional information with the purpose of obtaining information about the causes of the event. Often one can find the topic discussed in fora delivering valuable information of what really happened at that moment.
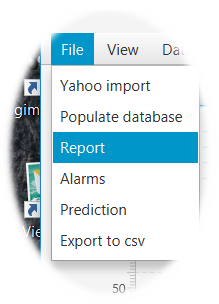
Fig. 23 How to obtain a report about the daily situation of stocks.
Choosing the item "Report" in the "File" menu will generate a file "report.csv" in your installation directory. This will take a few minutes, regretfully there is at this moment no means of knowing if the generation has come to an end, but you can always look in the Windows Explo(d/r)er, if you are using Windows, and see if the size of report.csv became nonzero. This file can be directly imported in any spreadsheet and shows, a line per ticker, the values explained for items 6 and 7 here. An item that can be chosen from the "view" menu is "deviation":
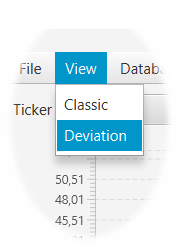
Fig. 24 Chose "deviation" from the "view" menu.
This menu item changes the display mode of the data. Instead of plotting the values of the stock its differences with respect to the C.R. are shown. It is as if the red line was stretched to a horizontal line and the data being bent accordingly. This separates the "noise" from the "signal", the latter being reduced to a horizontal line:
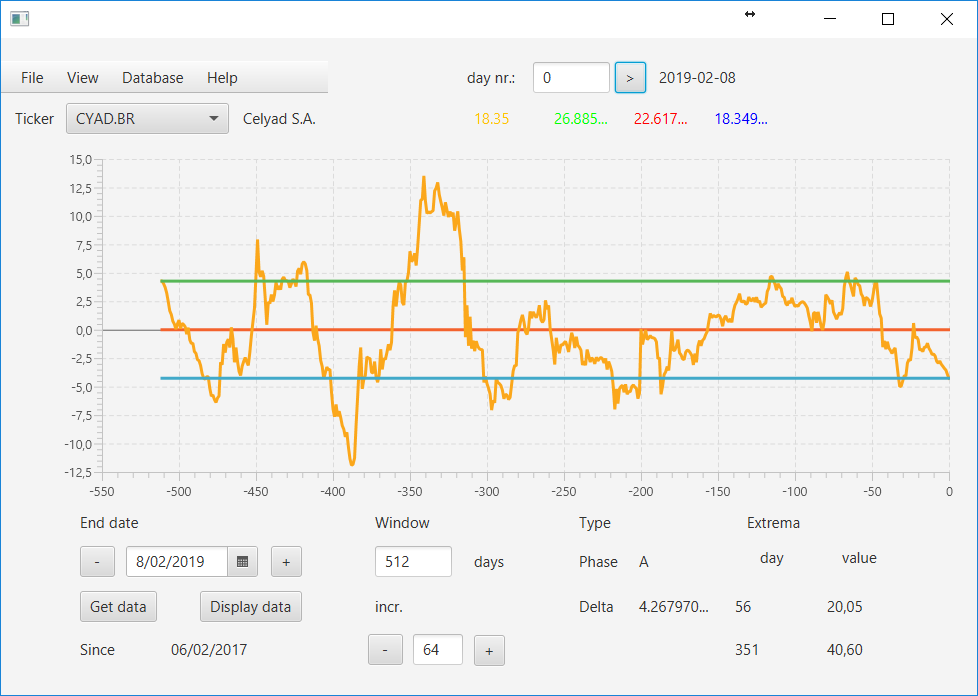
Fig. 25 The data shown in deviation mode.
In our case we see that the stock is very volatile before day -300, but stabilizes afterwards.