How do I obtain the C.R. of the stocks of the company "Celyad S.A."?
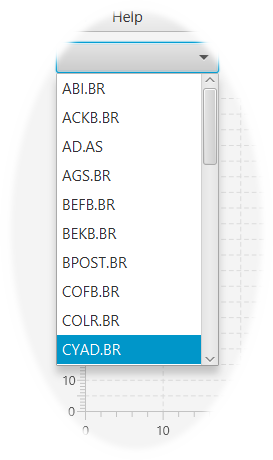
Fig. 18 A view of the drop down box containing the tickers of the stocks present in the database
I know that the ticker of this company is "CYAD", so I open up the drop down box and click "CYAD".
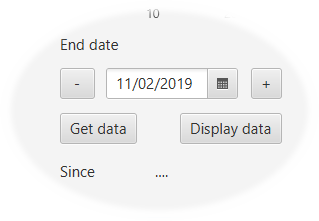
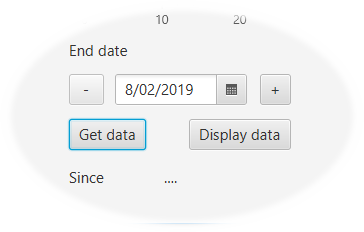
Fig. 19 The value of the date picker before and after hitting the "Get data" button.
After a valid ticker has been selected hitting the "Get data" button cause the following:
- All available data predating the date in the date picker is loaded, up to the number of days specified in the "window" field. This field is preset to 512 days, which is almost exactly the number of working days in two years. I like this value because it is a power of two: 512 = 29 and also because I'm a careful person and like to know what has been happening quite a while ago. You can change the value of the "window" to any value you like before pressing the "Get data" button.
- The value of the date picker is set to the last date available in the loaded set. If this date precedes the date you chose from the date picker, or today's date if you didn't, .This happens when the database has not been updated (see POPULATE THE DATABASE) or when it's Monday so the markets were closed during the weekend.
- The field "Since" now contains the date of the very first element in the loaded data set.
Pressing the "Display data button" now will causes the chosen data to be displayed:
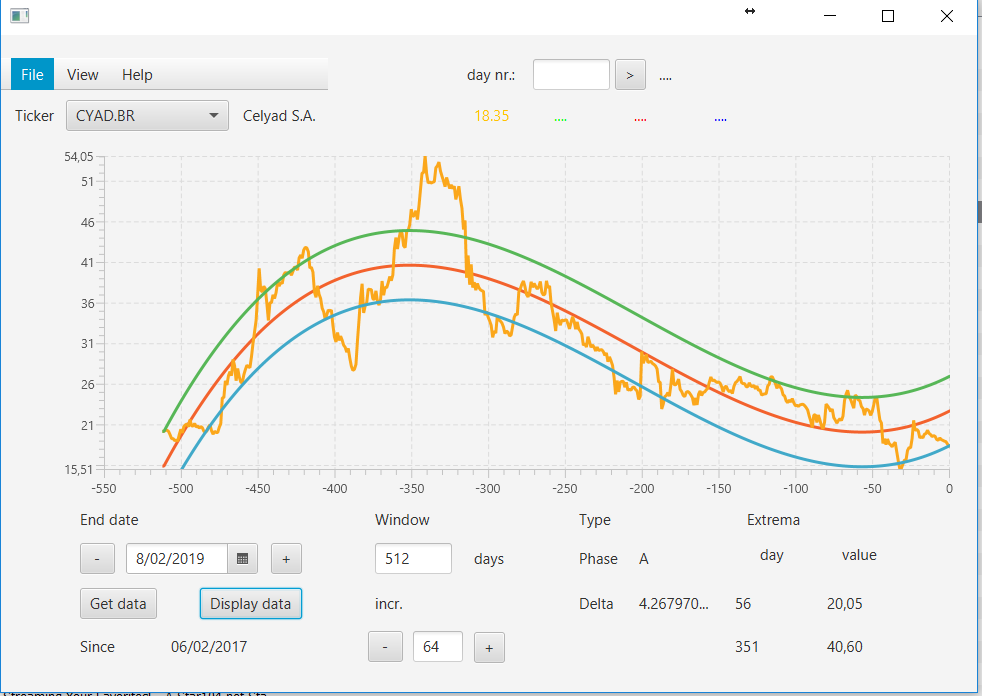
Fig. 20 The display of the stock values of Celyad and its C.R..
On the display we find: in yellow the real values of the stock, in red its C.R.. The green and blue lines are the value of the red line plus the value of the deviation , respectively minus this value. The yellow values going outside these values is an indication that the stock is volatile. On the horizontal axis we find the number of days into the past (that's why they're negative). On the vertical axis the corresponding values in the monetary unit of the concerned market.
Apart from this graphic display the program give us additional information as explained on the next page.